Market Snapshot
Above stats are produced each month (late at night when I should be resting I feel the need to crank out the stats to keep my insight on par). Our board doesn’t crunch these as scientifically, so it does take a while to pull it all together. I have notes and proof piled up in my Dropbox if you wish to dig into this in further detail. If I ever meet someone nerdier than I when it comes to Penticton real estate stats, that will be the day! Or night as it may be. I am posting this on the eve of my favourite Wednesday morning staff meeting.
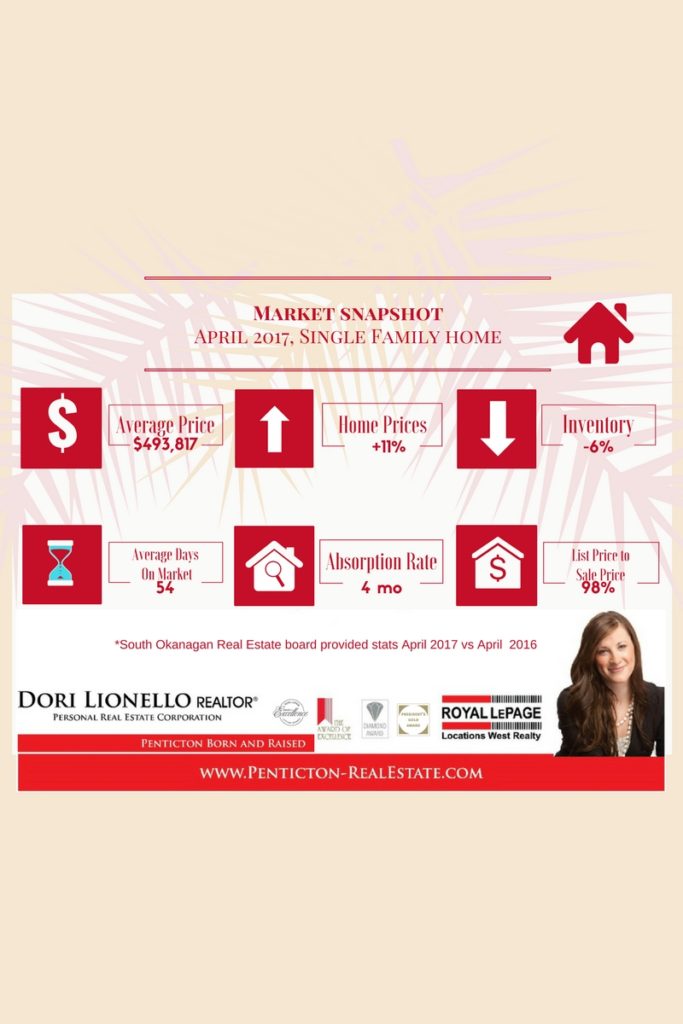
Take Home Point: This month over last month shows an increase in the average price of 11% instead of last months whopping 25%. As stats can get skewed by a few higher end sales, I decided to do this every month to watch where we are at. Anyone invested in this market knows that a news report reporting homes prices are up XXXX percent but what does that mean, and where are they sourcing their info? Every client that comes into my office or the random person at my favorite CrossFit will comment, “I hear prices are up 10-25%.” The reality is we are still up, but let’s get a six-month average with concrete numbers before we pull out that line of credit and hit the town!
I am happy to see the year over year increase in average prices. Days on the market is in the same realm of 54 days vs. last months 50 days. Perhaps volume overload affecting productive offices reporting time.
Lastly, listings are still selling for 98% of list price. With little inventory, these numbers are still encouraging you to LIST your home and get that price in the sweet spot to get over list competing offers!!!!